See how every theme change moves revenue.
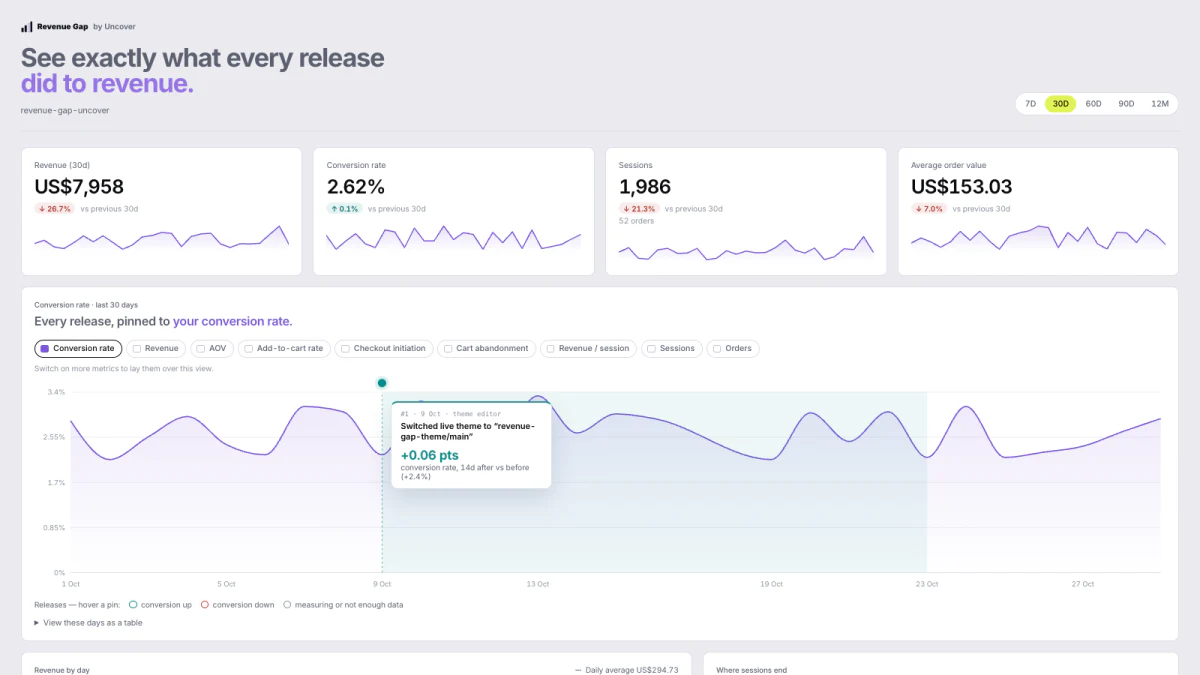
Revenue Gap puts revenue, conversion rate, AOV and funnel metrics on one timeline, then marks every theme change on it. Pick a release and see what it did to each number.
Free plan available. Works without GA4. Built by a Shopify Select Partner.
The revenue gap
Most stores ship changes and never find out what they did.
Not because nobody cares, but because the record of what changed and the record of what happened are kept in different places. That distance is the gap.
The change and the number live apart
Shopify tells you revenue moved. Your repo tells you what shipped. Nothing puts the two on the same line, so the link between them is guesswork.
Funnel data goes missing
Add-to-cart and checkout rates usually sit in GA4, behind consent banners, sampling and a model nobody on the team fully trusts.
The answer arrives too late
By the time someone asks what the redesign did, three more releases have landed and the before period is gone.
How it works
Three steps, then it runs on its own.
01 01
Install from the App Store
The app reads orders through the Admin API and installs a Shopify web pixel for storefront events. Nothing to add to your theme, no GA4 property to wire up.
02 02
Connect your repo, or log changes by hand
Point the app at a GitHub repository and merged pull requests appear on the timeline automatically, with their titles and dates. No repo, or changes made in the theme editor? Add them manually in a few seconds.
03 03
Compare before and after
Pick any change and the app compares the days either side of it across every metric it tracks, so you can see what moved and by how much.
What you get
Conversion metrics over time, annotated with each change.
Metrics tracked
- Revenue
- Conversion rate
- Average order value
- Sessions
- Product views
- Add to cart rate
- Checkout rate
- Refund rate
- New vs returning
-
One timeline, updated nightly
Revenue, conversion rate, average order value and funnel metrics on a single chart. A nightly sync keeps it current without anyone opening a dashboard.
-
Every theme change marked on the chart
Merged pull requests annotate the timeline automatically through GitHub. Manual entries cover theme editor edits, app installs and campaign launches.
-
Before and after comparison
Each change gets a measured result instead of an opinion: the days before against the days after, metric by metric.
-
Funnel tracking without GA4
A built-in web pixel captures sessions, product views, add to cart and checkout. It works whether or not GA4 is installed, and it does not depend on it.
-
Alerts on significant moves
When a key metric shifts meaningfully after a change, the app flags it, so a regression gets caught in days rather than at the end of the quarter.
Inside the app
What you are actually looking at.
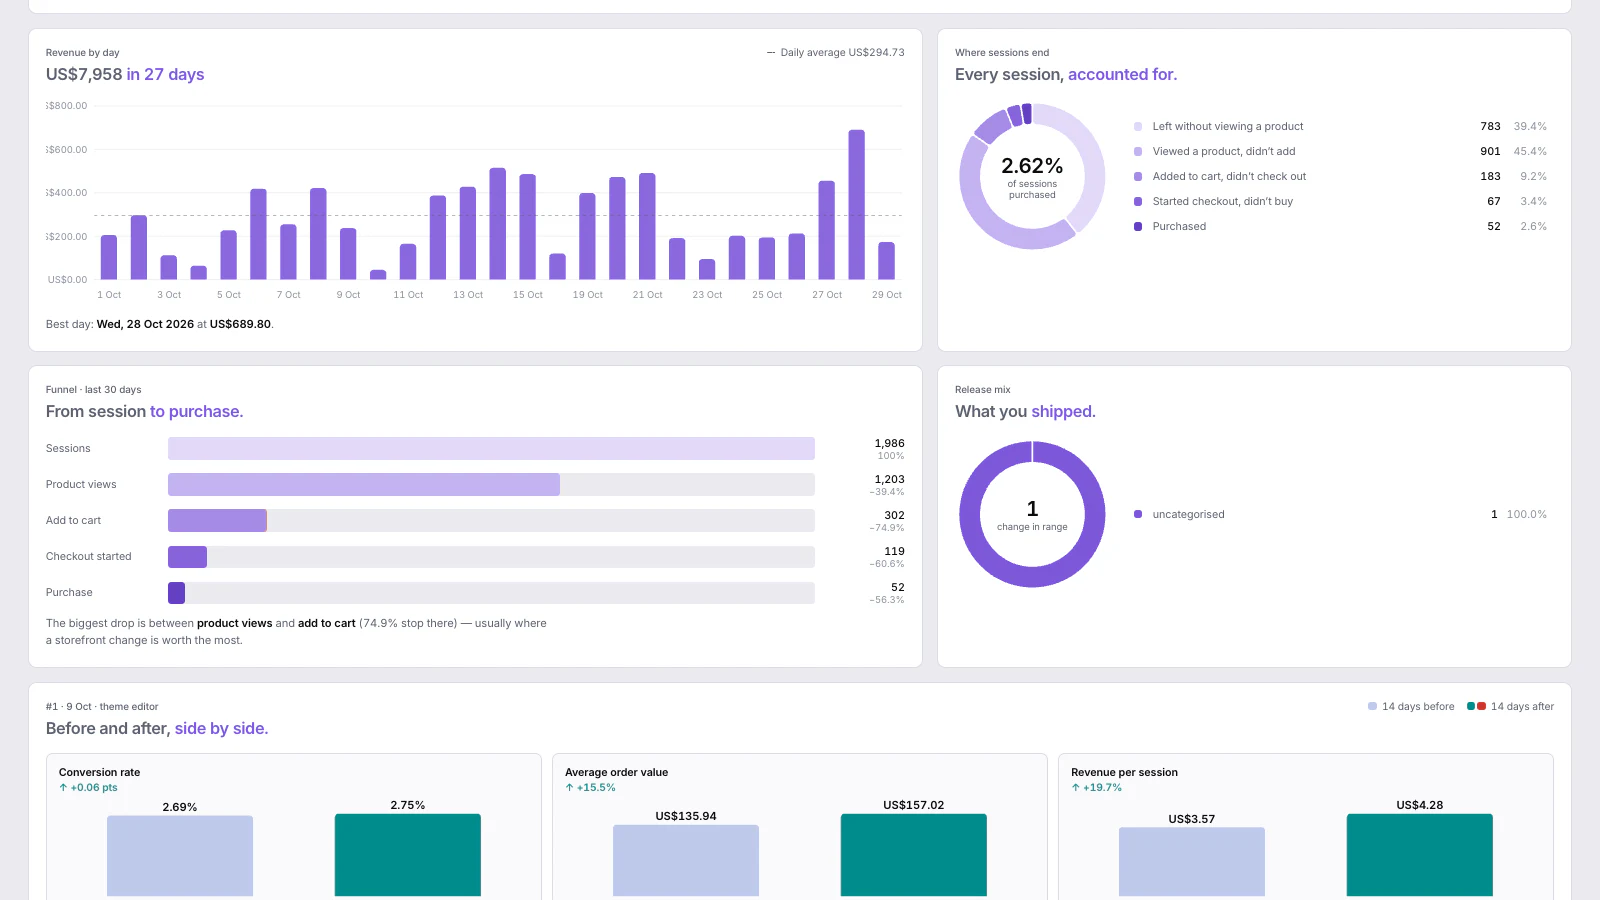
These are screens from our own development store, so the numbers on them are small. The shape of it is the same on a store doing real volume.
Where the sessions went, and where they stopped
Revenue by day against its own average, the full funnel from first visit to purchase, and every session accounted for by the point it dropped out. The funnel calls out its own biggest drop, which is usually where a storefront change is worth the most.
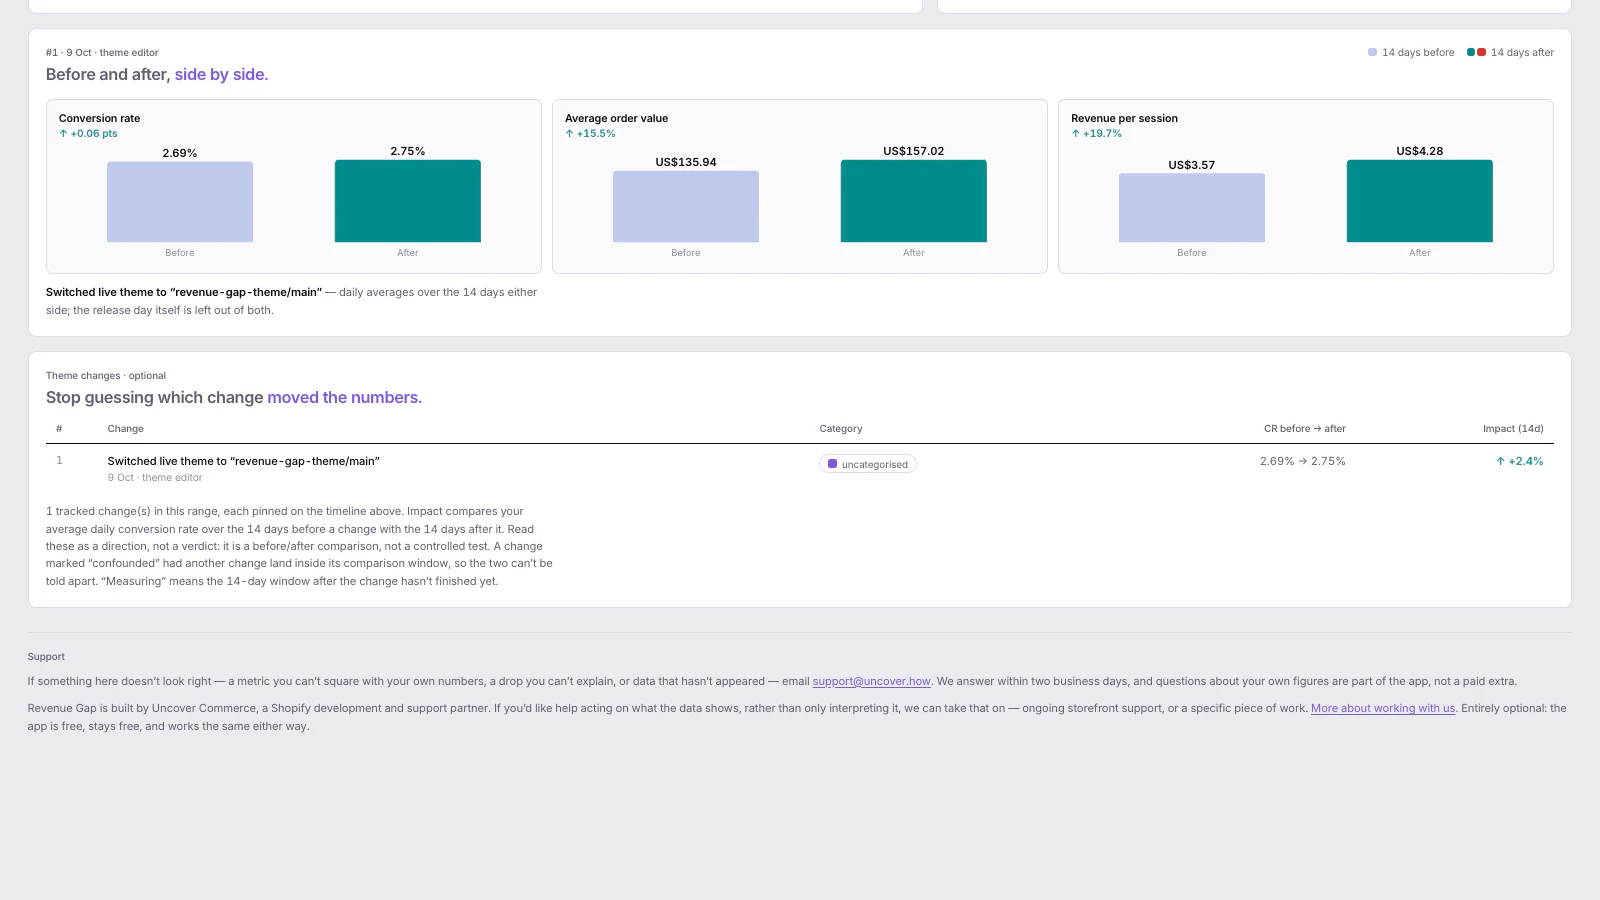
Before and after, for every change you log
Each change gets conversion rate, average order value and revenue per session compared across the 14 days either side, with the release day itself left out of both. Read it as a direction rather than a verdict: it is a before and after comparison, not a controlled test, and the app says so on the screen.
Pricing
Same features on every plan. You pay for how far back you can look.
Free
30 days of history
Enough to see what your last month of releases did, at no cost.
Start freeStandard
60 days of history
Compare a change against the month before it, not just the week.
Choose StandardPremium
12 months of history
Season on season comparisons, and every release you have made this year.
Choose PremiumOn every plan, including free
- GitHub annotations
- Manual change logging
- Before and after comparison
- Funnel tracking via the web pixel
- Nightly sync
- Alerts on significant moves
All charges are billed in USD through Shopify. Recurring and usage-based charges are billed every 30 days. Full plan details are on the App Store listing.
Data and privacy
Your store's numbers, and nobody's customer list.
The app does not request customer names, email addresses, phone numbers or physical addresses. Orders are read by a nightly job and aggregated into daily store-level metrics. Pixel events are stripped of identity fields before they are stored, and only anonymous counts are kept. Your data stays private to your store: it is never pooled into benchmarks, sold, shared with advertisers, or used to train models.
Read the full privacy policyFAQ
Questions merchants ask
If yours is not here, send it over and we will answer it.
Do I need Google Analytics 4 for this to work?
No. Funnel metrics come from a Shopify web pixel the app installs itself, so sessions, add to cart and checkout rates are captured whether or not GA4 is on the store.
How do theme changes get onto the timeline?
Two ways. Connect a GitHub repository and merged pull requests are added automatically with their titles and dates. Anything made outside the repo, such as a theme editor tweak or an app install, can be logged by hand.
How often does the data refresh?
A nightly sync pulls the previous day's orders and aggregates the pixel events, so each morning the timeline covers everything up to the day before.
What data does the app access?
Order history and store analytics through the Admin API, anonymous storefront events through the web pixel, and your theme for context. The app does not request customer names, email addresses, phone numbers or physical addresses, and order-level data is aggregated into daily store metrics rather than displayed or exported.
Will the pixel slow my store down?
The app uses Shopify's web pixel framework, so the tracking runs in Shopify's own sandbox rather than as a script added to your theme. There is no theme code to install and nothing to remove if you uninstall.
Is there a free plan, and what do the paid plans add?
Yes, there is a free plan. The only difference between the tiers is how far back the timeline goes: 30 days on free, 60 days on Standard at $100 a month, and 12 months on Premium at $300 a month. Every feature is on every plan, including GitHub annotations, the funnel pixel, alerts and before and after comparisons. Charges are billed in USD through Shopify every 30 days.
What happens to my history if I downgrade?
Nothing is deleted. A shorter plan hides the older part of the timeline rather than removing it, so moving back up restores the full range straight away.
Who builds it?
Uncover Commerce, a Shopify agency in Glasgow. We built it for our own client work, because we needed a way to show merchants what each release actually did, and then published it.
Find out what your last release actually did.
Install Revenue Gap on the free plan, connect your repo, and the next change you ship gets a measured before and after.